Regular lattice shapefiles with geopandas
For a project a while ago I wanted to create shapefiles of regular lattices (as opposed to the SA1 / SA2 boundaries that often are used in Austraila). For example a lattice of hexagons where each hexagon has side length 1km. Or alternatively a lattice of squares. Furthermore, it is often useful to be able to estimate a quantity in a new geometry, based on the quantity is another geometry. For example, we may want to estimate the population in each hexagon based on the values in the intersecting SA1 or SA2 polygons.
I created three Jupyter notebooks to carry out these tasks:
The first generates a shapefile consisting of regular hexagons covering a particular area of interest;
The second is similar to the above but contains code for generating both hexagonal and square lattices;
The third one shows how to estimate the population contained in each of the hexagons based on the 2016 Census counts at the SA1 level.
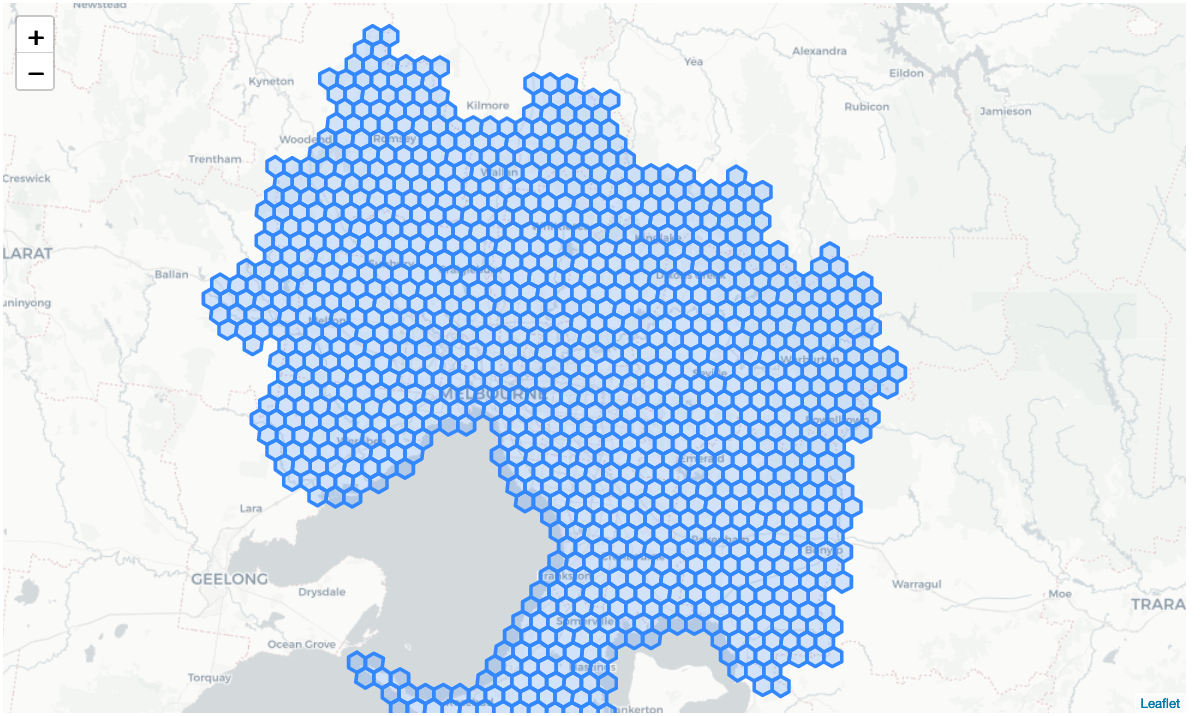
And here is a nice picture of a hexgrid: